FIGURE SUMMARY 2023
(*) Lamb, includes other birds and meats.
MEAT PRODUCTION
0 %
0 %
0 %
0 %
MEAT PRODUCTION EVOLUTION – TONS CWE
(*) Lamb, includes other birds and meats.
Source: Created by ChileCarne with data from Chilean Customs and the Chilean Statistical Institute.
MEAT EXPORT EVOLUTION – MUS$
(*) Lamb, includes other birds and meats.
Source: Created by ChileCarne with data from Chilean Customs and the Chilean Statistical Institute.
PER CAPITA MEAT CONSUMPTION / TONS CWE
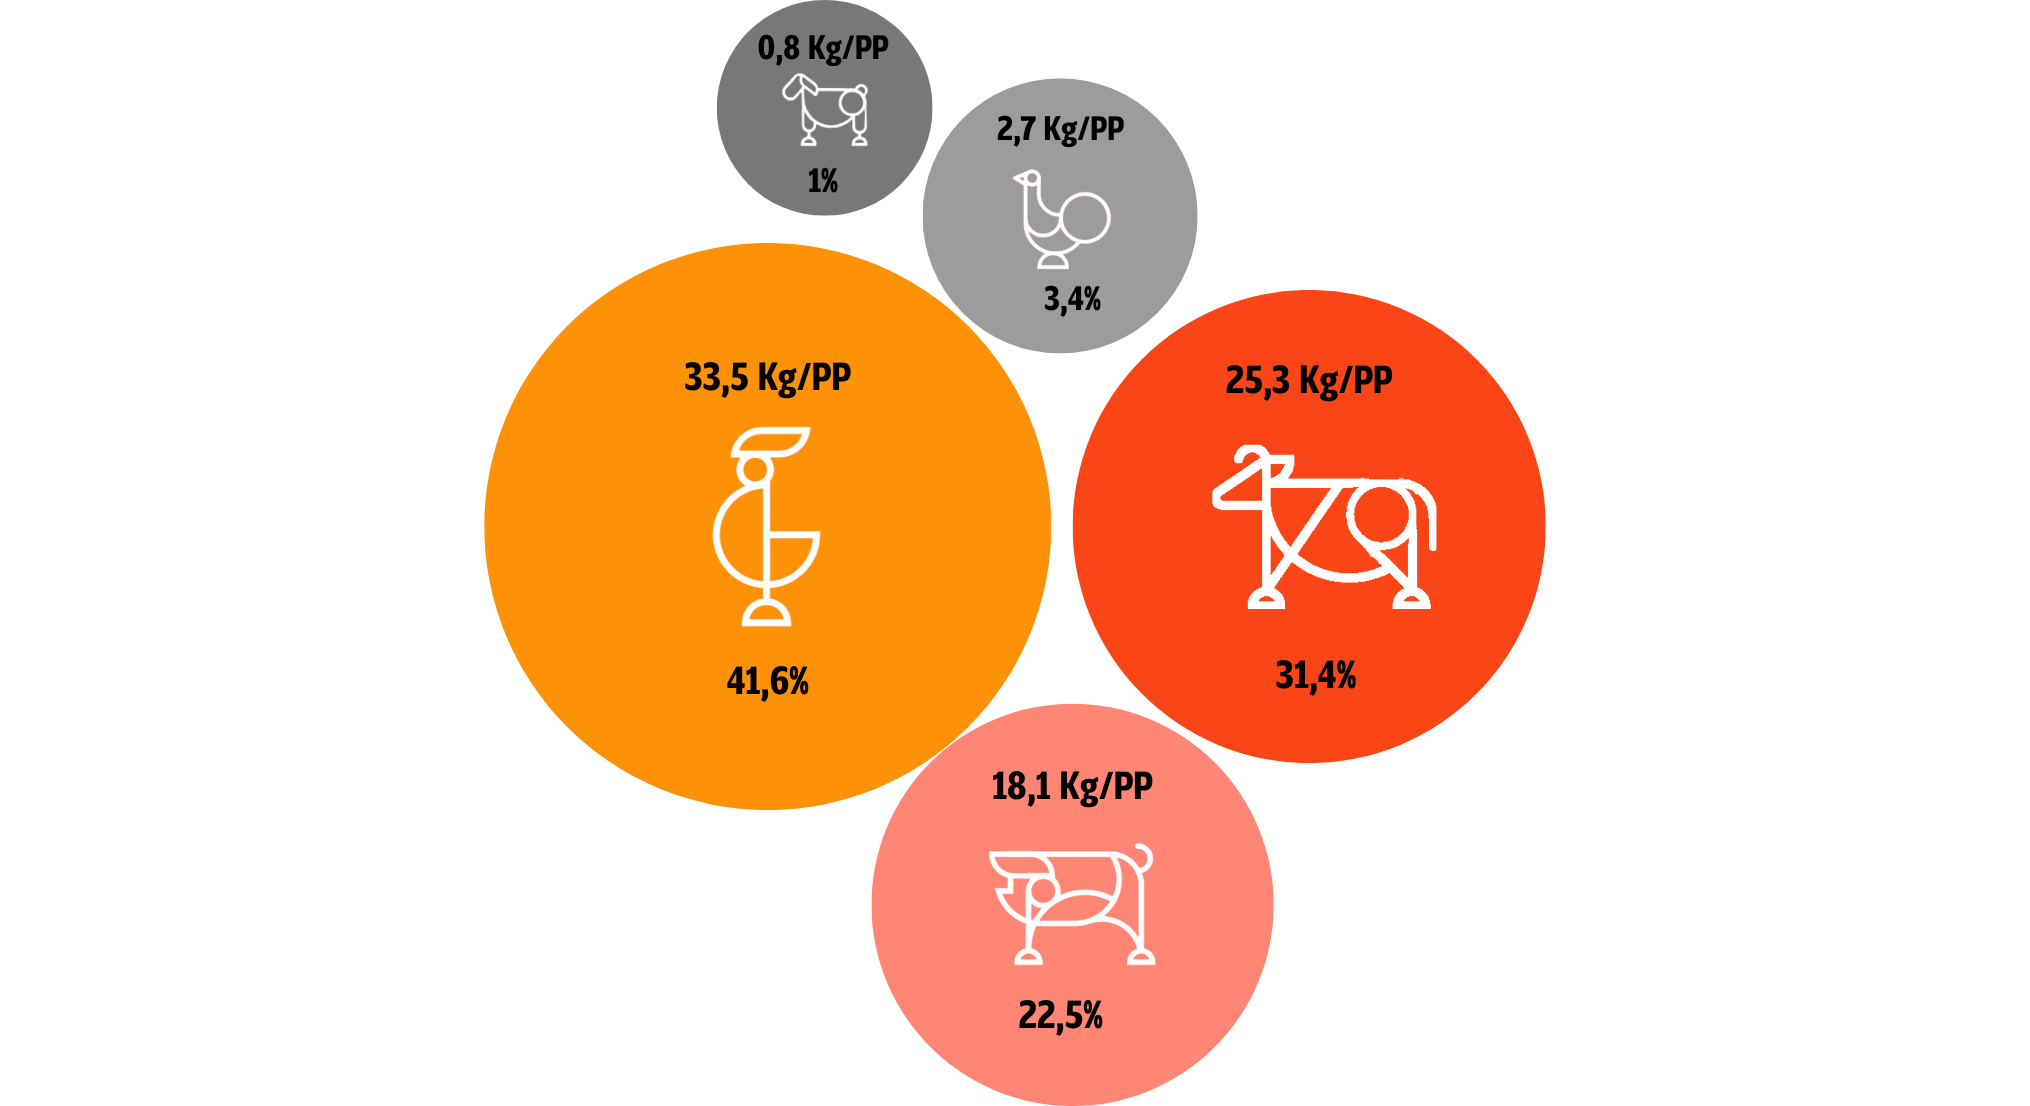
(*) Lamb, includes other birds and meats.
Source: Created by ChileCarne with data from Chilean Customs and the Chilean Statistical Institute.
CHILEAN WHITE MEAT INDUSTRY
1,3
Millions tons
Production 2023
Source: INE
1,111
Millions USD
Exports 2023
Source: INE
+33,000
Workers
and their families
Source: Industry
WORLD EXPORTS RANKING
GLOBAL POULTRY EXPORTS RANKING
Tons cwe
| 2023 | 2024F | Var. | |||
| 1. | Brazil | 4,770 | 1. | 4,925 | 3% |
| 2. | US | 3,300 | 2. | 3,308 | 0% |
| 3. | EU | 1,715 | 3. | 1,715 | 0% |
| 4. | Thailand | 1,105 | 4. | 1,135 | 3% |
| 5. | China | 545 | 5. | 550 | 1% |
| 6. | Turkey | 450 | 6. | 490 | 9% |
| 13. | Chile | 75 | 13. | 100 | 33% |
| Others | 1,599 | 1,678 | 5% | ||
| Global Total | 13,559 | 13,901 | 3% |
GLOBAL PORK EXPORTS RANKING
Tons cwe
| 2023 | 2024F | Var. | |||
| 1. | EU | 3,100 | 2. | 3,100 | 0% |
| 2. | US | 3.070 | 1. | 3,116 | 1% |
| 3. | Brazil | 1,414 | 3. | 1,500 | 6% |
| 4. | Canada | 1,300 | 4. | 1,310 | 1% |
| 5. | Chile | 260 | 5. | 265 | 2% |
| 5. | Mexico | 260 | 5. | 265 | 2% |
| 6. | Rusia | 210 | 6. | 220 | 5% |
| 7. | UK | 180 | 7. | 170 | -6% |
| 8. | China | 92 | 8. | 110 | 20% |
| Others | 121 | 129 | 7% | ||
| Global Total | 10,007 | 10,185 | 2% |
Source: USDA.
WHITE MEAT EXPORTATION (IN VALUE)

Source: Created by ChileCarne with data from Chilean Customs and the Chilean Statistical Institute.
MEAT EXPORTS (VOLUME)
Source: Created by ChileCarne with data from Chilean Customs and Chilean Statistical Institute.